
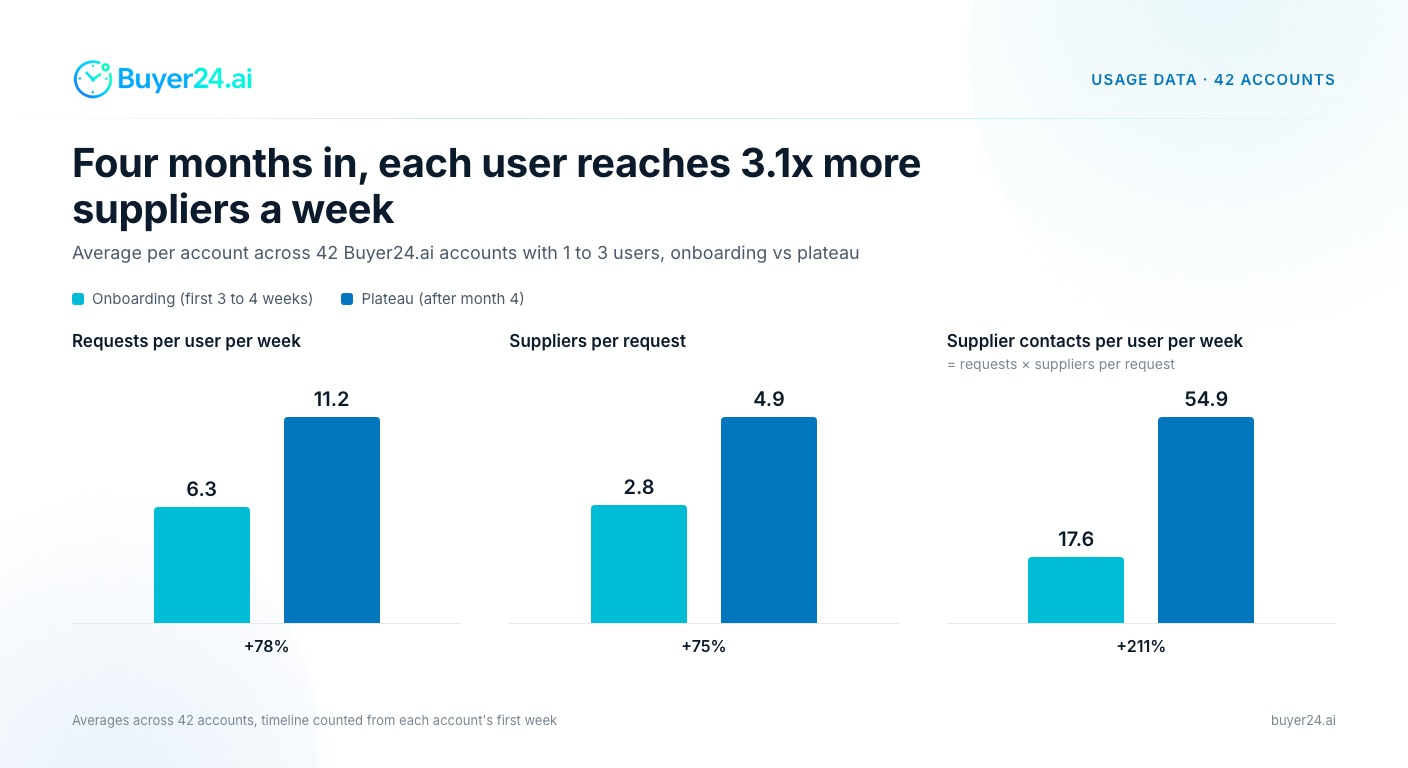
Small teams on Buyer24.ai nearly double their weekly request volume and raise the number of suppliers per request by three quarters within about four months, then settle at a stable level. We averaged usage across 42 active accounts to see how sourcing behavior changes from the first week onward.
This is a usage report. It shows what buyers do on the platform, counted from their first week. It does not measure what those requests won. The sections on what the data means and why usage levels off are our reading and our hypotheses, and they are labelled as such.
Who we looked at
- 42 accounts, each with 1 to 3 users on the platform.
- Small businesses and independent entrepreneurs, mostly resellers and procurement agents.
- Mixed industries: MRO, government procurement, electronics, casting.
- The timeline runs from each account's first week, so every account starts at week 1 regardless of its sign-up date.
- All figures are averages across the 42 accounts. Segments differ in level, but each follows the same overall trend.
Three phases of adoption
- Onboarding, the first three to four weeks. Users set up their workspace, send first requests and learn how supplier responses come back. At the same time, the platform adapts to each organization's context: what it buys, which suppliers it works with and how it phrases requests.
- Growth, to month four. Request volume and supplier reach climb steadily as the platform becomes part of the weekly routine.
- Plateau, after month four. Activity levels off gradually and stays at the new, higher baseline.
What changes between onboarding and plateau
| Measure | Onboarding | Plateau | Change |
|---|---|---|---|
| Requests per user per week | 6.3 | 11.2 | +78% |
| Suppliers per request | 2.8 | 4.9 | +75% |
| Supplier contacts per user per week | 17.6 | 54.9 | +211% |
Supplier contacts are requests multiplied by suppliers per request. Requests grow by about three quarters and suppliers per request grow by 75%, so the same team covers roughly 3.1 times more of the market each week than it did in its first month.
What it means for small buyers: our interpretation
These points are how we read the data, not measured outcomes.
- More requests. Once a request takes minutes instead of hours, buyers send requests for purchases they previously handled by phone or did not source at all.
- Wider supplier pool. 75% more suppliers per request means more competing quotes per purchase. That is where price and lead-time gains come from, as we argue in our guide to AI procurement for small business.
- Four months to full value. The plateau suggests teams reach a steady working rhythm within one quarter of starting.
Why usage levels off: our hypotheses
The plateau is most likely set by the buyers' own demand, not by the platform. Growth comes from winning more deals on speed, and it stops once sales capacity runs out.
- Growth phase: speed wins more competitive deals. Faster quotes from more suppliers let a team answer customer requests before competitors do. They bid on opportunities they used to skip and win a larger share of them.
- Plateau: demand caps request volume. A reseller or procurement agent with one to three people only sends as many RFQs as its customers create. Once every incoming need goes through Buyer24, request volume cannot grow further.
- The real limit is sales capacity. When sourcing is no longer the bottleneck, growth depends on how many customers the team can find and serve. The platform has removed the sourcing constraint; the next one is selling.
If these hold, the next step for growth is helping small buyers win more customers, not only source faster.
| Hypothesis | What we should see in the data |
|---|---|
| Speed wins deals | Time to first quote drops during growth; win rate or orders per request rise |
| Demand caps volume | Accounts with more customers plateau higher; the plateau level tracks customer order volume |
| Sales capacity is the limit | Plateau height scales with team size (1 vs 3 users); growth resumes when an account adds a salesperson or customers |
Limitations and what comes next
- The data is heavily averaged. Individual segments plateau at different levels, but the three-phase pattern holds across them.
- We do not always see how our clients' own customers respond, so we cannot yet show reliable win-rate or sales figures. The hypotheses above remain to be confirmed.
- A follow-up report will cover how supplier behavior changes as buyers ramp up.
FAQ
What was measured?
Requests sent per user per week and suppliers contacted per request, averaged across 42 active Buyer24.ai accounts with 1 to 3 users each. Each account's timeline is counted from its first week on the platform.
What is a supplier contact?
Requests per user per week multiplied by suppliers per request. It approximates how much of the market one user reaches in a week. At the plateau it averages 54.9 contacts a week, against 17.6 during onboarding.
Are these customer results?
No. They describe usage on the platform. Win rates, time saved and revenue are not measured in this report. Where the post interprets the data or explains the plateau, it says so.
How long does it take to reach the plateau?
About four months on average. The first three to four weeks are onboarding, growth continues to month four, and activity then levels off at the higher baseline.
Key takeaways
- Across 42 accounts, requests per user per week rose from 6.3 during onboarding to 11.2 at the plateau, and suppliers per request from 2.8 to 4.9.
- Supplier contacts per user per week tripled, from 17.6 to 54.9, so one user covers roughly 3.1 times more of the market.
- Adoption follows three phases: onboarding in the first three to four weeks, growth to month four, then a plateau.
- Our hypothesis is that the plateau is set by the buyer's own demand and sales capacity, not by the platform. The follow-up data to confirm or refute it is listed above.
- Teams that want to see their own first four weeks can start free, with no credit card required.